In this post, guest blogger Joe Howard, a Ph.D. student in the School of Education’s higher education (CSHPE) program, discusses CRLT’s study of LSA’s Quantitative Reasoning (QR) requirement–-and the implications of that research for instructors at U-M.

Whether mathematically inclined or not, today’s college graduates will be expected to “navigate a sea of numbers on a daily basis” in their careers and daily lives (Grawe, 2012, p. 30). A majority of employers interviewed in a recent study noted that they want universities to enhance their quantitative reasoning (QR) skills, or students' ability to work with numbers and understand statistics (Hart Research Associates, 2009). These include:
- The ability to make sense of information displayed in a number of formats (graphs, tables, diagrams, equations) and to convert information from one format to another.
- Competency in mathematical calculation.
- The use of evidence in drawing conclusions about numerical data and the ability to assess the limitations of the evidence.
- The ability to describe and evaluate assumptions for estimation, data analysis, and modeling.
Nearly all U-M schools and colleges have some curricular QR requirement to help students build these skills. What teaching strategies are working best in such courses? In 2009, CRLT collaborated with the College of the Literature, Science, and Arts (LSA) to assess its QR requirement. The findings (summarized here) suggest that many U-M teachers are maximizing student learning by using strategies that research has proven effective for strengthening students' QR skills. Here are some examples:
- Use active note-taking to promote problem-solving skills: Dr. Brenda Gunderson, in U-M's Department of Statistics, uses a lecture notepack with “Try It!” problems embedded throughout the lecture notes. Rather than emphasizing notetaking on capturing equations or definitions, the coursepack prioritizes problem-solving. In addition, Gunderson uses iClickers to scaffold difficult questions with peer discussion. Doing so, she notes, “mandates a sense of engagement” among her more than 1700 students.
- Provide multiple assessment opportunities with feedback: Research tells us that multiple opportunities for student assessment – when paired with instructor feedback – foster a rich learning environment. In Evaluating Information (COMM 211), Michael Traugott and Nick Valentino have assigned weekly quizzes along with multiple papers and exams scattered throughout the semester. Assignments occurring later in the term are weighted more heavily, allowing students the opportunity to make mistakes as they grow in confidence and capability. Professor Ed Rothman, in Statistical Principles for Problem Solving: A Systems Approach, assigns 14 memos in which students must apply a statistical concept to a “real-life” situation. Some memo assignments require the student to orally defend their reasoning to Rothman, allowing the student the opportunity to receive feedback on their reasoning and suggestions for improving future memos.
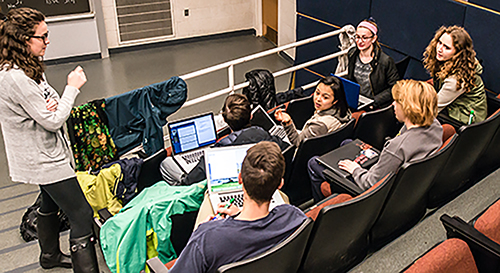
- Capitalize on collaborative learning opportunities: Collaborative learning is one key educational practice that has been shown to increase student engagement and retention. In U-M's Calculus I, nearly all of the instruction is orientated to group problem-solving. Student gains on the Calculus Concept Inventory for U-M are significantly higher compared to calculus courses at 25 other colleges and universities, suggesting the approach is effective.
 Slide with tsunami exercise. Click image to enlarge.
- Use real-world problems: Despite strong research findings that this is an effective technique for teaching QR, the 2009 study found that many LSA students did not perceive that their instructors were using (or effectively using) "real-world problem solving" in their courses. However, there are several examples of successful incorporation of such practices in U-M classrooms. For instance, Brian Arbic’s Introductory Oceanography (EARTH 222/ENVIRON 232) course incorporates problems based on issues studied by oceanographers. Students are encouraged to bring laptops to class, and they work in teams on questions such as how long it would have taken for the 2004 tsunami to travel from its source in Indonesia to given points on the Indian and African coasts (see diagram). The scholarship on student learning provides many additional examples of faculty teaching QR through real-world problems:
- Schield (2008) developed and uses a 10 element model to help students dissect current news stories which contain statistical information in a course titled Quantitative Reasoning and Statistical Literacy.
- Atkinson and colleagues (2006) use real-world data in their introductory sociology course at North Carolina State University. Students analyze recent population studies to unearth sociological “knowns” such as income disparity and its relationship to education, gender, and race.
- In his history course at Miami University, Gene Metcalf has students research and mock-up a full scale floor plan of a typical Puritan house (using masking tape on the floor). In doing so, students come to learn that the average six-person family lived in a space of about 300 square feet, prompting discussions about the cultural implications of these factors. According to Metcalf, the exercise “gave them a better feel for life in a Puritan community and the relationship between the material world and culture” (Wolfe, 1993, p. 6).
In today’s data-rich world, the importance of QR skills will only grow, yet these courses can be difficult to teach. If you’re interested in learning more approaches, consider visiting the National Numeracy Network, Carleton’s QuIRK Initiative, Statlit, or SIGMAA-QL. These organizations provide a wide array of resources for faculty looking to enhance their QR pedagogy.
References
Atkinson, M. P., Czaja R. F., & Brewster, Z. W. (2006). Integrating sociological research into large introductory courses: Learning content and increasing quantitative literacy. Teaching Sociology, 34(1), 54-64.
Grawe, N. D. (2012, Spring). Achieving a quantitative literate society: Resources and community to support national change. Liberal Education: 30-35.
Hart Research Associates. (2009). Raising the bar: Employers’ views on college learning in the wake of the economic downturn. A survey of employers collected on behalf of the Association of American Colleges and Universities. Washington, DC: Hart Research Associates.
Schield, Milo (2008). Analyzing numbers in the news: A critical-thinking structured approach. Unpublished paper presented at the National Numeracy Network Conference, New London, NH.
Wolfe, C. R. (1993, Winter). Quantitative reasoning across a college curriculum. College Teaching, 41(1), 3-9.
Image credit Eric Wüstenhagen on Flickr (CC BY-SA 2.0)
- Log in to post comments
- 254 views